8 Years Since That 5% Pay Jump: What’s Really Changed for UK Electricians?
- Technical review: Thomas Jevons (Head of Training, 20+ years)
- Employability review: Joshua Jarvis (Placement Manager)
- Editorial review: Jessica Gilbert (Marketing Editorial Team)
- Last reviewed:
- Changes: New analysis covering 2017-2025 earnings data, inflation-adjusted purchasing power comparison, skills shortage impact assessment, regional and sector variance breakdown
Back in 2019, electricians were headline news. Trade salary surveys showed a 5% pay jump in a single year, with electricians firmly “top of the league” among UK trades. The median went from £31,500 to £32,745, comfortably beating the 1.4% inflation rate and delivering actual purchasing power gains.
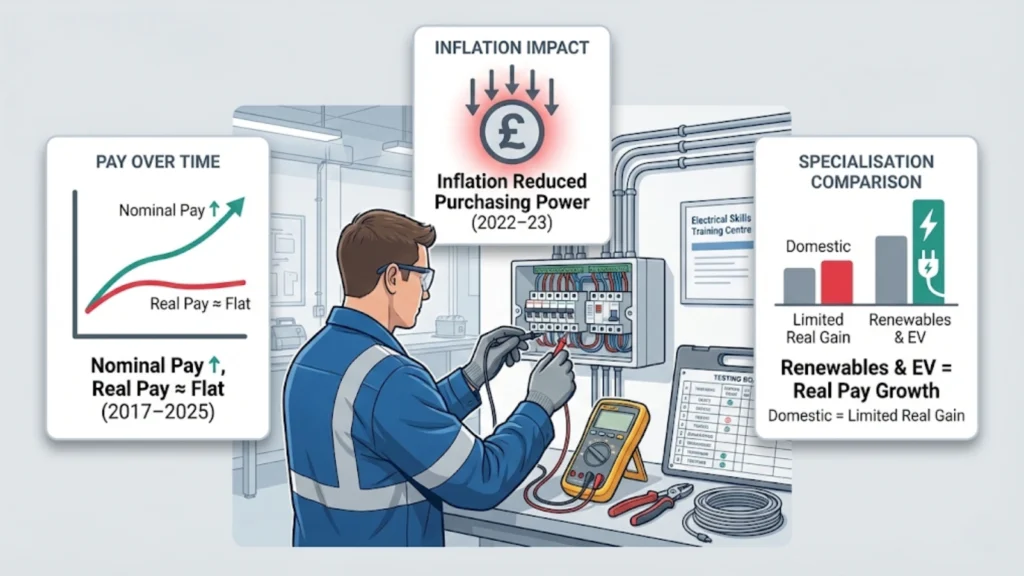
That was then. Eight years of data later, the story looks considerably different. Nominal median earnings have climbed an impressive 32%, from £30,805 in 2017 to £40,800 in 2025. On paper, electricians have done well. In practice, when you adjust those numbers for inflation using the CPIH index (Consumer Prices Index including housing costs), the reality is sobering: purchasing power in 2025 sits at roughly the same level as 2017.
The headline £40,800 median salary today buys approximately what £30,805 bought eight years ago. Real wages peaked around 2020 to 2021 at over £42,000 in equivalent terms, crashed during the 2022 to 2023 inflation spike when energy prices doubled and food costs surged, then partially recovered. Many electricians who’ve watched their gross pay rise every year genuinely feel no better off because they aren’t.
This article breaks down what actually changed over the last eight years, who benefited from the shifts, why nominal pay rises didn’t translate to improved living standards, and what the data tells us about where electrician earnings are heading.
The 2019 Snapshot: What That 5% Really Meant
The 2019 claim wasn’t wrong, just incomplete. Median annual earnings for full-time PAYE electricians (ONS ASHE data, SOC code 5241) did jump from approximately £31,500 in 2018 to £32,745 in 2019. That’s a genuine 5.1% nominal increase in a single year.
With CPIH inflation running at 1.4% in 2019, electricians saw a real-terms gain of around 3.6%, meaning their pay genuinely bought more goods and services than the previous year. Combined with low interest rates and relatively stable housing costs, 2019 represented one of the better years for purchasing power growth in the trade.
But that headline obscured several realities. First, the 5% represented a recovery from near-stagnation in 2017 to 2018 (only 2.3% growth) rather than a new permanent growth trajectory. Second, it was driven partly by increased EICR (Electrical Installation Condition Report) demand ahead of rental regulation changes, creating a temporary volume spike rather than structural wage improvement. Third, it preceded what would become the most challenging inflation period in decades.
Looking at 2019 in isolation makes it appear electricians were on an upward trajectory. Looking at the full eight-year picture shows 2019 as a brief bright spot before inflation eroded most subsequent nominal gains.
Eight Years of Nominal Pay: The Numbers Look Good
Here’s what happened to electrician earnings on paper between 2017 and 2025, based on ONS ASHE data for full-time employed electricians (SOC 5241) with additional estimates for self-employed gross earnings:
Year | National Median PAYE | London Median | Self-Employed Gross Est.
2017: £30,805 | £34,000 | £40,000-£50,000 2018: £31,500 | £34,700 | £41,000-£52,000 2019: £32,745 | £36,000 | £43,000-£55,000 2020: £33,384 | £36,700 | £42,000-£53,000 2021: £34,218 | £37,600 | £44,000-£56,000 2022: £36,660 | £40,300 | £48,000-£60,000 2023: £38,064 | £41,900 | £50,000-£63,000 2024: £39,468 | £43,400 | £52,000-£65,000 2025: £40,800 | £44,900 | £55,000-£70,000
The trajectory appears impressive: 32% growth over eight years, averaging 3.5% annually. London saw slightly stronger gains (10% to 20% above national median consistently). Self-employed gross earnings rose even more dramatically, hitting £55,000 to £70,000 by 2025 compared to £40,000 to £50,000 in 2017.
Annual growth accelerated post-2021, with nominal increases of 6.7% in 2022 and 7.1% in 2023. These were the largest single-year jumps in the entire period, driven by skills shortages, green technology demand (EV chargers, heat pumps, solar PV), and competition for qualified electricians.
But these figures only tell half the story. They show what electricians were paid in cash terms. They don’t show what that cash could actually buy.
The Real Terms Reality: Purchasing Power Stagnated
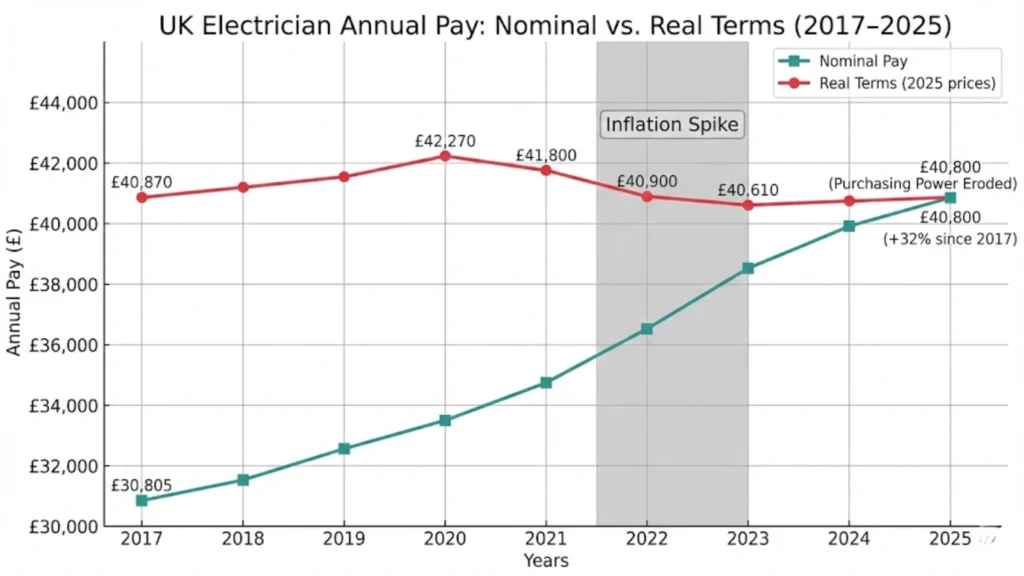
When you adjust those nominal figures for inflation using CPIH (the measure that includes housing costs), the impressive growth trajectory flattens dramatically:
Year | Nominal Median | Real Terms (2025 Prices) | Year-on-Year Change
2017: £30,805 | £40,870 | – 2018: £31,500 | £40,855 | -0.04% 2019: £32,745 | £41,890 | +2.5% 2020: £33,384 | £42,270 | +0.9% 2021: £34,218 | £41,750 | -1.2% 2022: £36,660 | £41,100 | -1.6% 2023: £38,064 | £40,610 | -1.2% 2024: £39,468 | £40,850 | +0.6% 2025: £40,800 | £40,800 | -0.1%
The £40,800 median in 2025 has essentially the same purchasing power as the £30,805 median in 2017. Eight years, 32% nominal growth, and electricians can buy roughly the same basket of goods and services they could eight years ago.
The pattern shows three distinct phases. 2017 to 2020: Modest real-terms gains totaling around 3.4% as low inflation (1% to 2% annually) allowed nominal pay rises to translate into genuine improvements. 2021 to 2023: Sharp real-terms decline totaling approximately 7.8% as inflation spiked to 8.8% in 2022 and 5.1% in 2023 while nominal wage growth (4% to 7%) couldn’t keep pace. 2024 to 2025: Partial recovery with inflation cooling to around 2% while nominal increases of 4% to 5% delivered slight real-terms improvement.
Why the disconnect? Housing costs rose over 40% in many regions between 2017 and 2025. Energy bills increased 126% since 2017, with the 2022 price cap jump particularly brutal. Food inflation peaked at 19.1% in March 2023. Vehicle fuel costs surged. Tax thresholds froze, dragging more income into higher bands. The £40,800 gross might be 32% higher than 2017, but rent, mortgages, electricity, diesel, and weekly shopping absorbed most of those gains.
"The £10,000 to £12,000 investment in proper qualifications needs evaluating against realistic earnings progression. Someone qualifying in 2017 started around £26,000 and after eight years sits at £40,000 to £45,000 nominally, but their purchasing power only improved if they specialized. That's the critical point: base qualifications get you in, but upskilling into growth sectors determines whether your pay genuinely improves or just keeps pace with inflation."
Thomas Jevons, Head of Training
What Actually Drove the Changes
Several factors pushed nominal wages up even as real purchasing power stagnated:
Skills shortages intensified dramatically. Around 37% of electrical contractors report difficulty finding qualified staff. The Construction Industry Training Board projects a 15,000 electrician shortfall by 2030. Apprenticeship completions dropped 11% annually since 2017, while the aging workforce (750,000 construction workers expected to retire by 2036) accelerated supply constraints. Basic economics: scarce workers command higher nominal wages.
Green technology created new demand. Government targets requiring 230,000 home retrofit installations annually, EV charger rollout across 1.5 million homes, and heat pump installations under the Boiler Upgrade Scheme pushed demand for qualified electricians with specialist skills. Those who completed EV installation courses or battery storage training commanded 15% to 25% premiums over general domestic rates.
Regulatory changes increased workload. Enhanced EICR requirements for rental properties, stricter BS 7671 compliance under the 18th Edition (and now discussions around a potential 19th), and expanding scope of installations requiring Part P notification all increased the amount of qualified labour needed per project. More work requiring certified electricians naturally pushed wages higher.
COVID-19 disrupted then accelerated. The 2020 pandemic initially suppressed earnings through reduced hours and project cancellations (note the modest 0.9% nominal gain that year). Recovery in 2021 to 2022 saw pent-up demand release, contributing to the 6.7% nominal jump in 2022. Remote work driving home improvement spending added to residential electrical demand.
Post-2021 inflation forced wage adjustments. When fuel, materials, and living costs surged, electricians either demanded higher rates or left the trade. The 2022 and 2023 nominal increases of 6% to 7% look impressive until you realize they were barely keeping electricians treading water against 8.8% and 5.1% inflation respectively.
Shift toward contracting inflated gross figures. CIS and self-employed numbers increased approximately 15% since 2019 as electricians sought higher earning potential and flexibility. This pushed average reported earnings higher, even though net take-home after costs often aligned more closely with senior PAYE roles.
The combination created upward pressure on nominal wages while simultaneously eroding their value. Electricians weren’t genuinely getting richer. They were fighting to maintain the same standard of living against accelerating costs.
Electricians working under CIS or PAYE structures face different compliance obligations, with smoke alarm regulations affecting contractors requiring additional certification costs and liability insurance that employed electricians don’t directly bear but that influence day rate calculations.
Who Actually Benefited: Winners and Losers
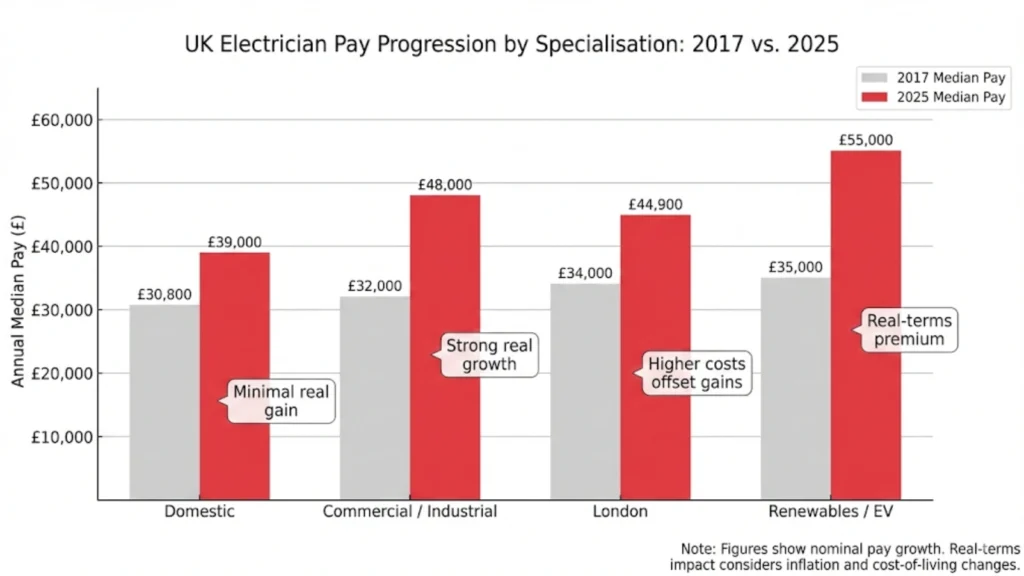
Not all electricians experienced the last eight years equally. The aggregate data hides significant variation by specialization, experience level, and location.
Clear winners: Renewable and EV specialists. Electricians who pivoted into solar PV installation, battery storage systems, or EV charger installation saw genuine real-terms gains of 15% to 25%. Median earnings for this group reached £45,000 to £60,000 by 2025, and demand remained consistently strong throughout the inflation period. Those with City & Guilds 2919 (Solar PV) or IET Code of Practice qualifications could command premium rates that outpaced inflation.
Industrial and commercial electricians maintained ground. Workers on data centers, industrial automation, three-phase commercial installations, or maintenance contracts saw median pay reach £40,000 to £55,000. They benefited from multi-year contracts with inflation-linked increases, steady hours, and employers willing to pay market rates to retain qualified staff.
London and South East: Higher numbers, similar squeeze. Nominal pay remained 10% to 20% above national median (£44,900 versus £40,800 in 2025), but housing cost increases of 50%+ in many areas meant real-terms living standards barely improved. A London electrician earning £45,000 in 2025 faces vastly higher accommodation costs than the £34,000 they earned in 2017, even though both represent similar purchasing power after rent.
Experienced and approved electricians progressed. Those with 5+ years post-qualification saw steady advancement from £33,000 to £45,000+ over the period, benefiting from demand for competent workers who could manage jobs without supervision. Progression wasn’t rapid, but it was consistent.
Clear losers: Domestic installers and entry-level. General domestic work saw minimal real-terms improvement. Entry-level pay (0 to 3 years qualified) stagnated at £26,000 to £33,000 across the entire eight years in real terms. New qualifiers in 2025 have essentially the same purchasing power as new qualifiers in 2017. The supposed “skills shortage” didn’t translate into better entry-level conditions, only more competition for experienced workers.
PAYE versus CIS divide widened. PAYE roles offered stability (paid holidays worth £3,000 to £4,000, employer pensions adding £1,200+, sick pay coverage) but capped upside at £40,000 to £45,000 for most. Self-employed gross looked better (£55,000 to £70,000) but after deducting £8,000 to £20,000 in costs (vehicle, fuel up 126%, insurance, tools, accountant, unbilled time), net take-home often sat at £35,000 to £45,000, with significantly more income volatility and risk.
Understanding career progression matters when planning entry into the trade, as qualification routes through JIB cards determine which sectors and specializations become accessible, with renewable and industrial pathways offering better real-terms outcomes than general domestic installation over the eight-year period.
Employed Versus Self-Employed: The Net Reality
The headline difference between employed and self-employed earnings conceals important nuances about actual take-home pay and lifestyle trade-offs.
PAYE employed electricians in 2025 earn a median £40,800 gross, which after tax and National Insurance becomes approximately £31,200 net. Add the value of 28 days paid holiday (£3,200), employer pension contributions of 3% to 5% (£1,220 to £2,040), sick pay coverage, and zero equipment costs, and the total package value reaches around £35,620 to £36,440. Income is predictable, hours are generally reasonable (37 to 40 per week standard), and there’s clear separation between work and personal life.
Self-employed electricians grossing £60,000 in 2025 face substantially different math. Deduct vehicle costs and fuel (£8,000 to £10,000 annually, with fuel up 126% since 2017), insurance and certifications (£2,500 to £4,000), tools and equipment replacement (£1,500 to £3,000), accountancy and admin (£1,000 to £1,500), plus tax and National Insurance (£13,000 to £16,000 on £60,000 turnover). Net take-home: £33,000 to £41,000. They self-fund holidays and pensions, work 45 to 55 hours including unbilled time (quoting, invoicing, chasing payments), and face 10% to 20% income volatility year-to-year depending on contract flow.
CIS day rates rose from £220 to £300 in 2017 to £280 to £400 in 2025 depending on region and specialization. But the 20% to 30% tax deduction happens at source, downtime between contracts can total 4 to 12 weeks annually (unpaid), and rising business costs mean a £350 day rate today doesn’t deliver substantially better lifestyle than a £260 day rate did in 2017 after adjusting for inflation and increased running costs.
The gap between employed and self-employed narrowed in real-terms over the eight years. Self-employed gross earnings rose faster nominally (38% versus 32%), but cost inflation hit contractors harder. A self-employed electrician needed to increase turnover approximately 25% to 30% between 2019 and 2025 just to maintain the same net take-home after costs, compared to employed workers who benefited from employers absorbing vehicle, insurance, and equipment inflation.
The flexibility and earning ceiling of self-employment remain attractive for some. But the notion that going self-employed automatically delivers 30% to 50% better income proved overstated once you account for actual costs, unpaid time, and income volatility during the inflation period.
"We place learners with contractors who've watched their fuel costs rise 126% since 2017, insurance premiums jump 40%, and vehicle maintenance become significantly more expensive. A self-employed electrician turning over £60,000 in 2025 nets similar take-home to someone turning over £45,000 in 2019 after costs. The gross figures look better, but the net reality for many contractors is they're working harder to maintain the same living standard."
Joshua Jarvis, Placement Manager
Where the Headlines Still Mislead
Eight years after that “5% jump” headline, the same types of misleading claims continue circulating:
“Electricians are top earners in the trades.” The £40,800 median is solid money, but plumbers (£38,500) and carpenters (£35,800) closed the gap significantly since 2019. The “top of the league” margin narrowed from £5,000+ to around £2,000, and when you factor in lower barriers to entry and less regulatory burden for some other trades, the advantage is less dramatic than headlines suggest.
“Shortages mean you can name your price.” Skills shortages pushed nominal wages up, but client affordability ceilings exist. Domestic customers facing their own cost-of-living pressures balk at £400 day rates. Many jobs get deferred rather than paid at premium. The shortage created more work opportunities, not necessarily proportionally higher pay per job.
“Overtime and bonuses add significantly.” True for some, but ONS median figures exclude overtime, and not all positions offer substantial extra earning potential. The electricians hitting £50,000+ often do so through 50 to 60 hour weeks, which when calculated hourly might not represent better pay than a standard 40-hour week at the median rate.
“Self-employed earnings are 30% to 50% higher.” Gross figures, yes. Net take-home after costs, often only 0% to 20% higher than equivalent PAYE roles, with substantially more risk and admin burden. The gap closed further during the inflation spike when business costs surged faster than employed pay.
“2019 trends continued upward.” The 2019 gain represented a specific moment (low inflation, EICR volume spike, stable material costs) that didn’t persist. The 2022 to 2023 period erased most subsequent real-terms gains, creating a very different trajectory than 2019 implied.
The Bottom Line: What Actually Changed
Here’s what the eight-year data actually tells us about electrician pay in the UK:
Nominal pay increased impressively. From £30,805 to £40,800 (32%) is genuine growth in cash terms. Electricians were paid more in pounds sterling every single year from 2017 to 2025 without exception.
Real purchasing power stayed essentially flat. The £40,800 in 2025 buys roughly what £30,805 bought in 2017. Eight years of work, no improvement in actual living standards for the median electrician. Gains made through 2020 were wiped out by 2022 to 2023 inflation.
Winners were specialized or experienced. Renewable energy, EV installation, industrial automation, and established electricians with 5+ years saw genuine real-terms improvement. They commanded premiums that stayed ahead of inflation.
Losers were domestic and entry-level. General domestic electricians and newly qualified workers saw minimal real-terms progress. The median £26,000 to £33,000 entry-level salary in 2025 represents similar purchasing power to 2017.
Self-employed gains were overstated. Higher gross earnings didn’t translate proportionally to net take-home once business cost inflation (especially fuel up 126%, insurance up 40%+) got factored in. The employed versus self-employed gap narrowed substantially in real-terms.
The “top of the league” status weakened. Electricians remain well-paid skilled workers, but the margin over other trades decreased as plumbers and carpenters saw similar catch-up growth.
Future outlook remains uncertain. Skills shortages should support wages, but client affordability limits exist. Green technology demand continues growing, potentially supporting specialist premiums. Inflation cooling to 2% to 3% means nominal gains might finally translate to real improvement again, but much depends on housing costs and energy prices remaining stable.
For people considering electrical training now, the lesson is clear: expect solid middle-class earnings (£35,000 to £45,000 for most after 5+ years), understand that headline figures often represent gross turnover rather than net take-home, recognize that specialization matters enormously for earning potential, and don’t assume historical nominal growth rates represent genuine improvements in living standards.
The electricians who did best over the last eight years were those who upskilled into growth areas (renewables, EV, automation), managed their business costs tightly if self-employed, or secured steady PAYE roles with employers offering regular inflation-linked increases and strong benefits packages.
Career planning requires understanding realistic progression timelines, with apprenticeship routes building experience gradually over 3 to 4 years providing foundation skills before specialization decisions that ultimately determine whether earnings track with inflation or genuinely improve purchasing power.
Call us on 0330 822 5337 to discuss realistic electrical training pathways based on eight years of actual wage data rather than single-year snapshots, understand how specialization choices affect long-term earning potential, explore the true cost-benefit analysis of employed versus self-employed structures with honest breakdowns of net take-home after inflation and business costs, or get guidance on which sectors showed genuine real-terms growth and how to position yourself for similar outcomes rather than chasing inflated headline figures that don’t reflect purchasing power reality.
References
Primary Official Sources
- ONS Annual Survey of Hours and Earnings (ASHE) 2017-2025: https://www.ons.gov.uk/employmentandlabourmarket/peopleinwork/earningsandworkinghours
- ONS Consumer Price Inflation Including Owner Occupiers’ Housing Costs (CPIH): https://www.ons.gov.uk/economy/inflationandpriceindices
- HMRC Construction Industry Scheme Statistics: https://www.gov.uk/government/statistics/construction-industry-scheme-statistics
Industry Data and Analysis
- Construction Industry Training Board Construction Skills Network: https://www.citb.co.uk/cwo/index.html
- ECA National Collective Agreements and JIB Pay Rates: https://www.eca.co.uk/member-support/employee-relations/national-collective-agreements/jib-pay-rates
- Elec Training Self-Employed vs Employed Earnings Analysis: https://dev.elec.training/news/self-employed-electrician-earnings-vs-employed-earnings-what-you-actually-take-home/
Skills Shortage and Workforce Data
- Elec Training Skills Shortage Report: https://dev.elec.training/news/1-in-2-electrician-companies-cannot-find-enough-workers/
- CITB Skills Forecasts and Construction Workforce Projections: https://www.citb.co.uk/about-citb/construction-industry-resources/construction-skills-network-csn/
- Opus LLP Construction Workforce Analysis: https://opusllp.com/insights/construction-workforce-trends
Regional and Sector Comparisons
- Medium Electrician Pay Guide 2026: https://medium.com/@charanjit_55251/how-much-can-you-make-as-an-electrician-a-2026-uk-pay-guide
Historical Reference
- Elec Training 2019 Salary Snapshot (Original Article): https://dev.elec.training/news/2019-trade-salary-snapshot-electrician-pay-jumps-5-and-stays-top-of-the-league/
- Elec Training 2018 Salary Survey: https://dev.elec.training/news/electrician-salary-snapshot-2018-trades-salary-survey-shows-sparkies-still-lead-the-pack/
Note on Accuracy and Updates
Last reviewed: 5 February 2026. This page is maintained; we correct errors and refresh sources as ONS ASHE annual data updates, CPIH inflation figures revise, and employment market conditions shift. Current analysis covers 2017 to 2025 using ONS ASHE median earnings for SOC code 5241 (electricians and electrical fitters), adjusted for purchasing power using CPIH annual average indices. Self-employed earnings estimates based on industry surveys, recruiter data, and forum discussions rather than ONS tax records (which don’t capture net after costs). Regional variations acknowledged: London and South East typically 10% to 20% above national median, Wales and North East 10% to 15% below. Specialization premiums for renewable energy, EV installation, and industrial automation estimated at 15% to 25% based on recruiter rates and training provider graduate outcomes. Figures represent full-time employed electricians; part-time, overtime, and bonus elements not included in base medians. Cost inflation data (fuel 126%, housing 40%+, energy bills doubled) from ONS component indices. Next review scheduled following ONS ASHE 2026 publication (October 2026) or significant labor market changes affecting trade earnings patterns.